About
Meta Platforms is the organization which operates in two business segments: Family of Apps (Facebook, Instagram, Messenger, WhatsApp) and Reality Labs (VR hardware, software and content). For family of apps Meta generates substantially all their revenues from selling advertising placements to marketers. Reality Labs generates revenue from sales of consumer hardware products, software and content. But most of its revenues come from the Family of Apps segment (in FY 2021 98% of revenues came from Family of Apps business segment and 2% of revenues came from Reality Labs segment).
Main competitors of Meta Platforms are companies which enable marketers to reach their existing or prospective audiences, for example, Alphabet (Google and YouTube) or Twitter.
Income Statement
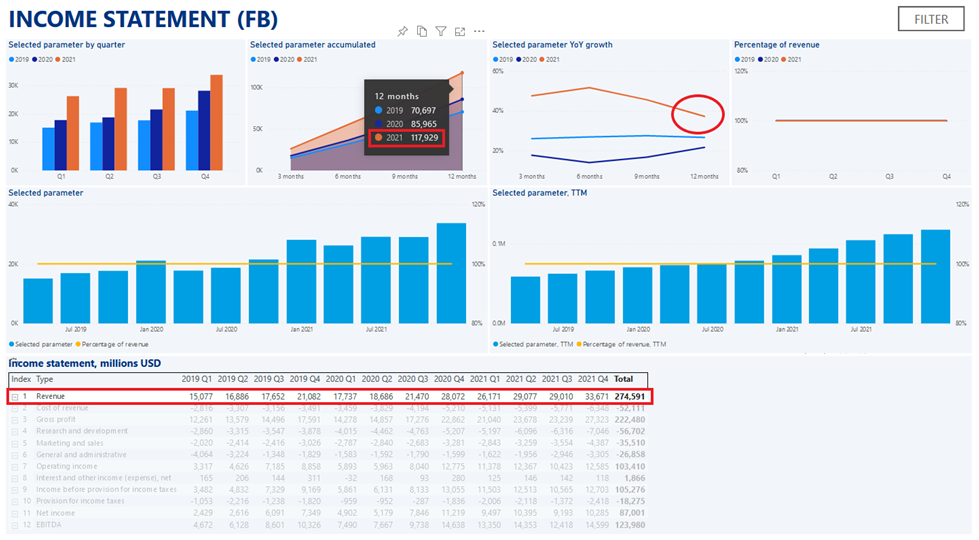
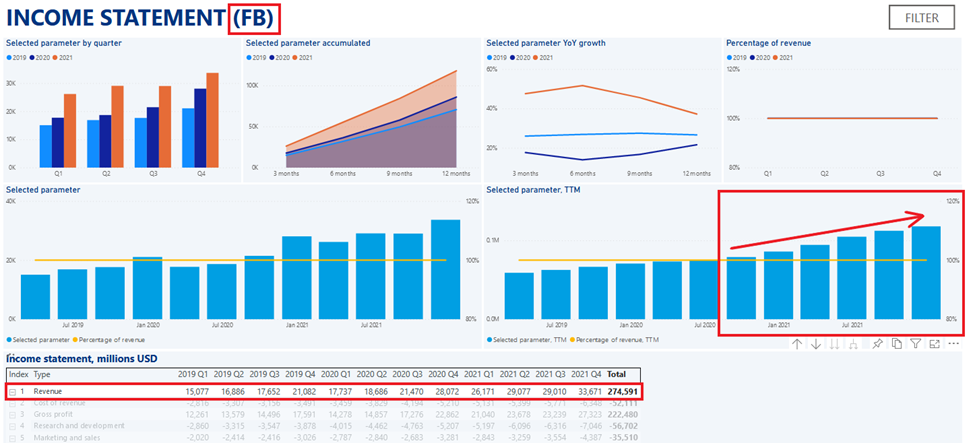
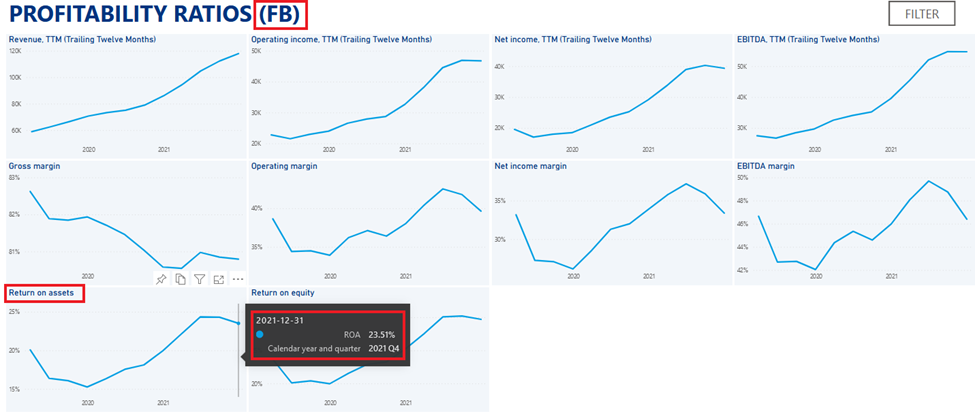
In 2021 Meta reported $117.929 billion in revenue (37.18% YoY growth).
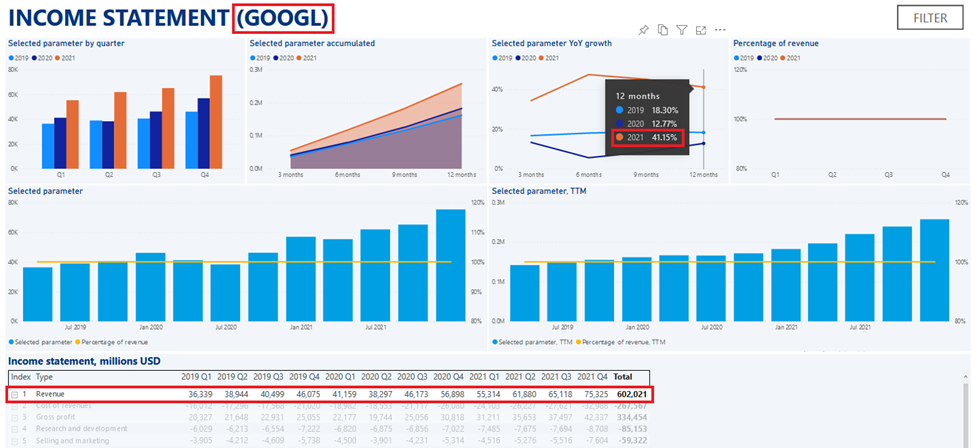
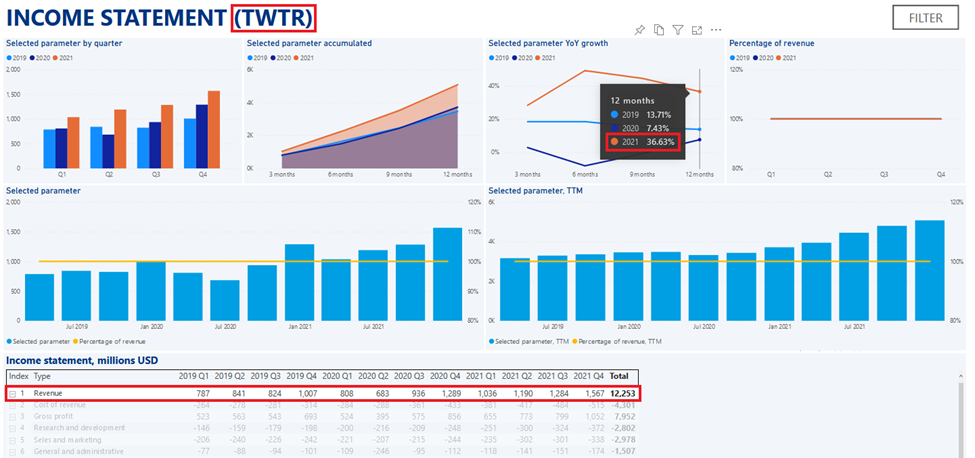
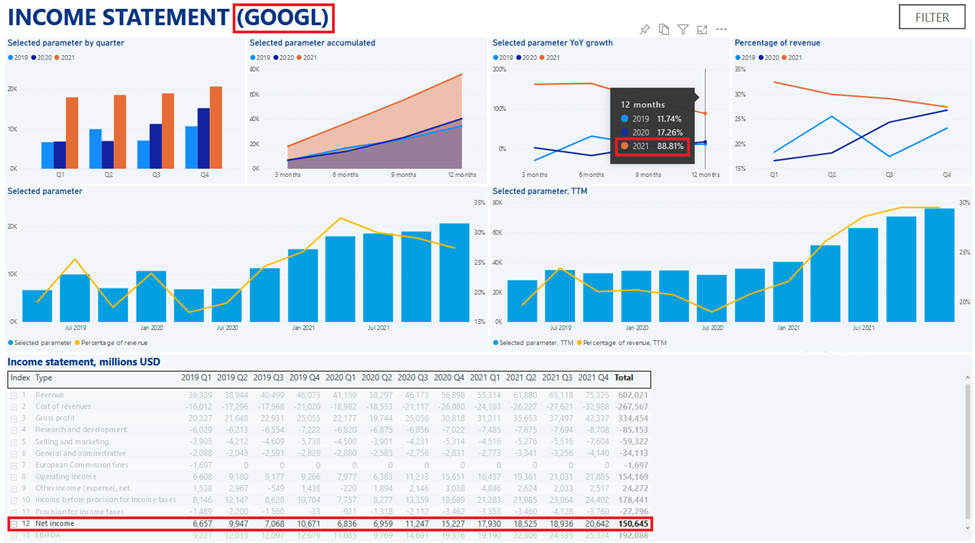
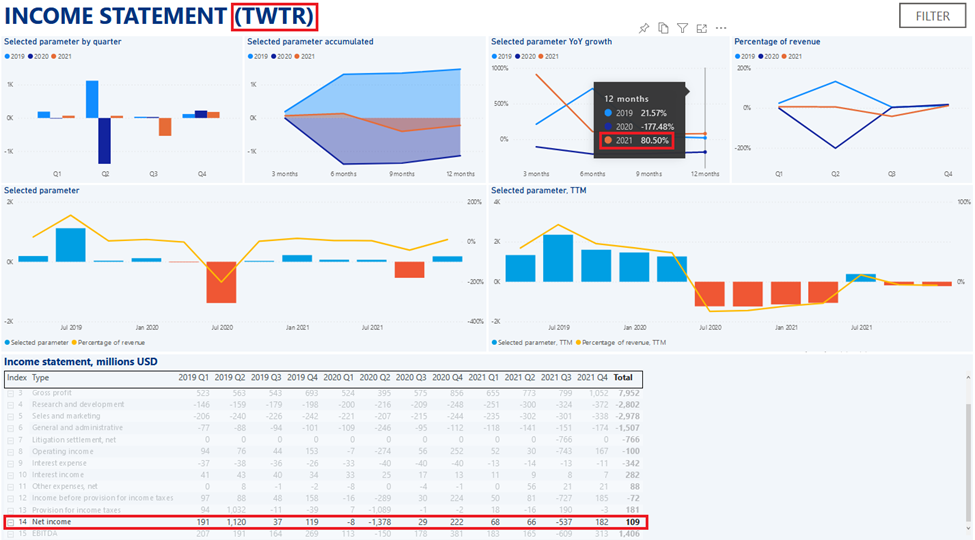
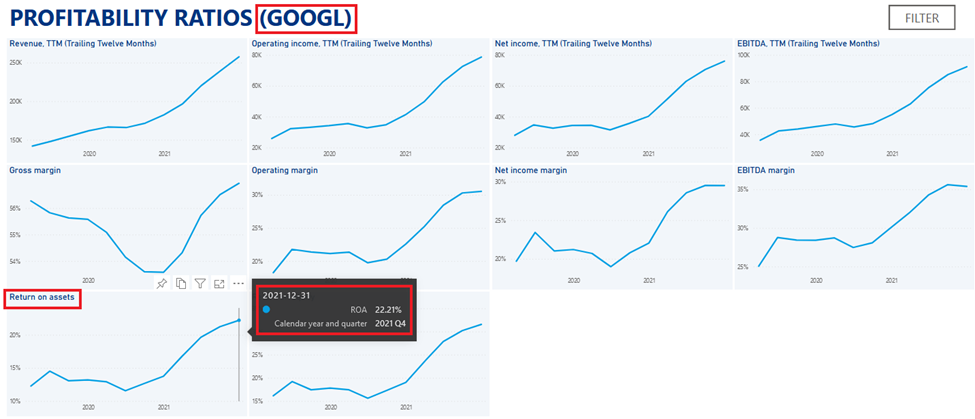
In comparison, competitors’ YoY revenue growth in 2021 were 41.15% for Alphabet (GOOGL) and 36.63% for Twitter (TWTR).
Below you can see that trailing twelve-month revenue of Meta had an increasing tendency:
In 2021 Meta Platforms’ operating income was $46.753 billion (43.1% YoY increase), but the 4Q 2021 operating income was 1.5% lower than in 4Q 2020.

GOOGL operating income YoY growth in 2021 was 90.94%, while TWTR operating income YoY growth in 2021 was negative -1,948.37% due to the $-766 million litigation settlement expense in 3Q 2021.


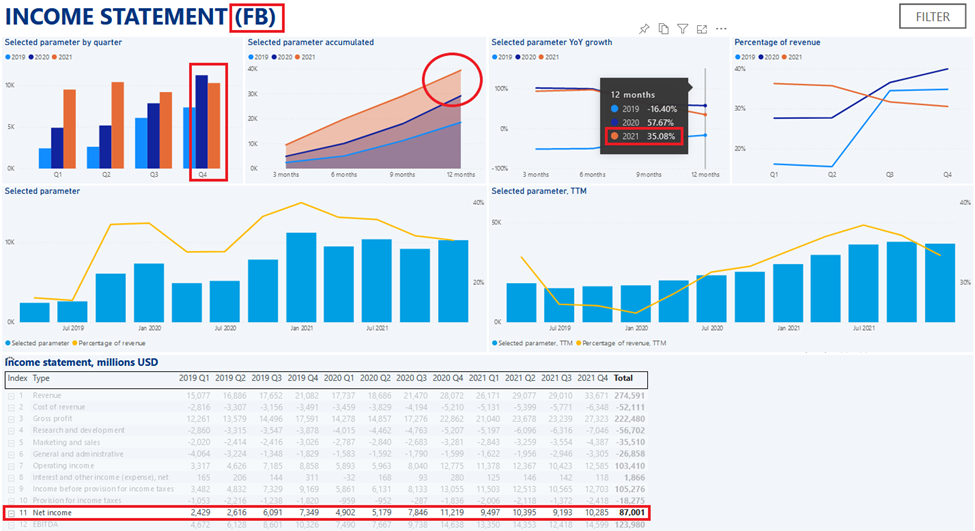
Net income reported by FB in 2021 was $39.37 billion which was 35.08% higher than in 2020. But the 4Q 2021 net income was 8.33% lower than in 4Q 2020.
In comparison, competitors’ YoY net income growth in 2021 were 88.81% for Alphabet (GOOGL) and 80.5% for Twitter (TWTR).
The trailing twelve-month operating margin of Meta at the end of 2021 was 39.65% (it was decreasing for the past two quarters).
For comparison Alphabet’s trailing twelve-month operating margin as at 2021.12.31 was 30.55%.
Twitter’s trailing twelve-month operating margin at the end of 2021 was negative (-9.73%)
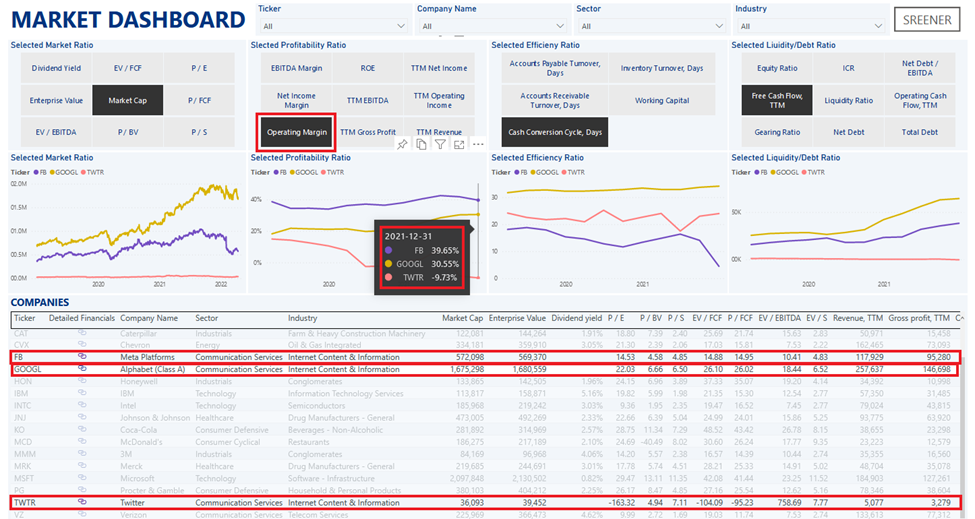
Throughout the period between 1Q 2019 and 4Q 2021 FB had the highest operating margin, while the TWTR had the lowest operating margin.
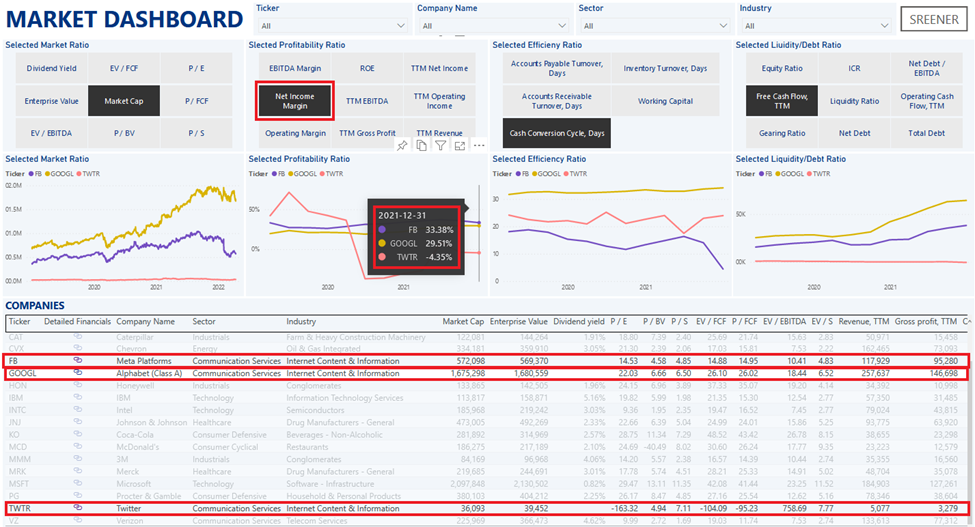
TTM net income margin at the end of 2021 for Meta was 33.38% (Alphabet had 29.51% margin and Twitter had -4,35% net margin). Starting from mid-year 2020 FB had the highest net margin out of these three companies.
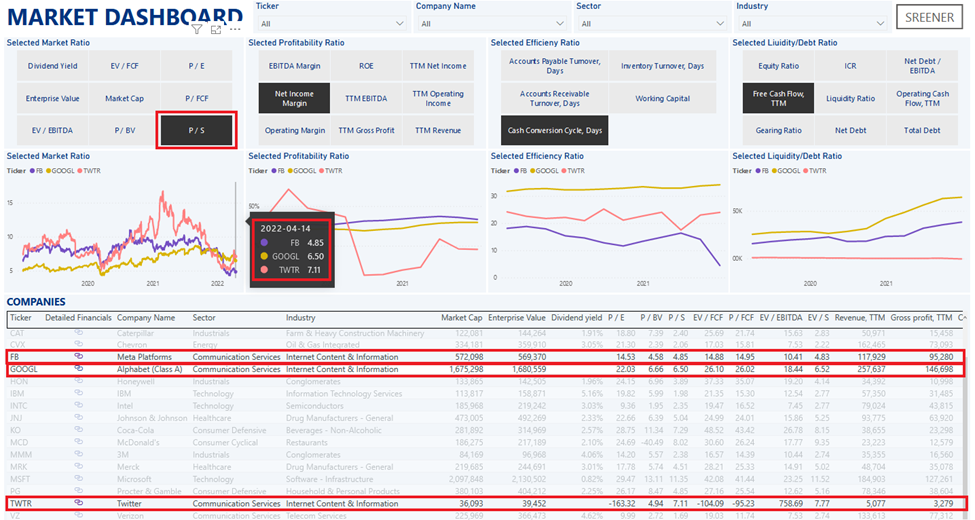
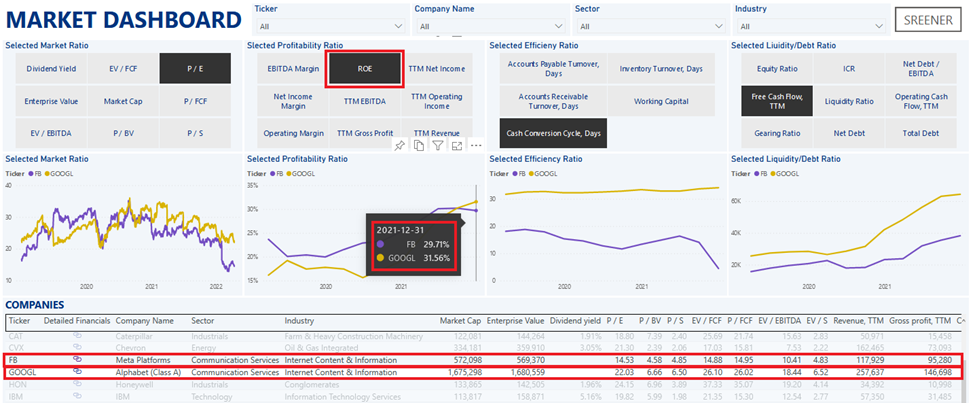
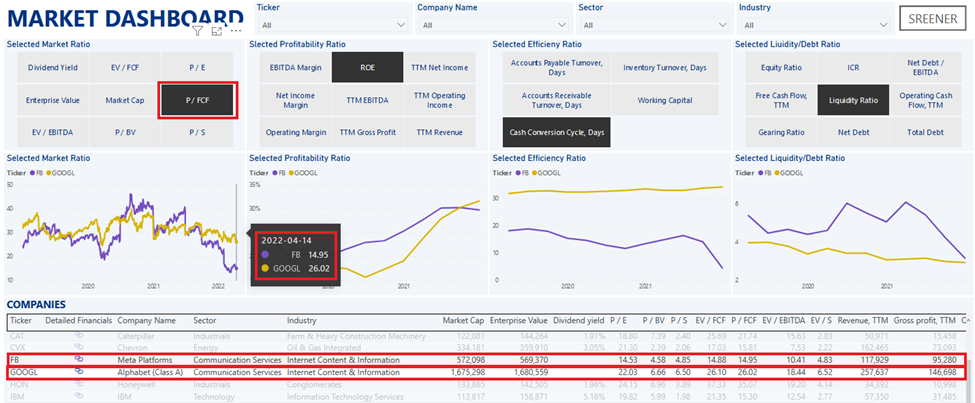
As of 2022-04-14, FB has the lowest price-to-sales ratio of 4.85 (while GOOGL has a ratio of 6.5 and TWTR ratio is 7.11)
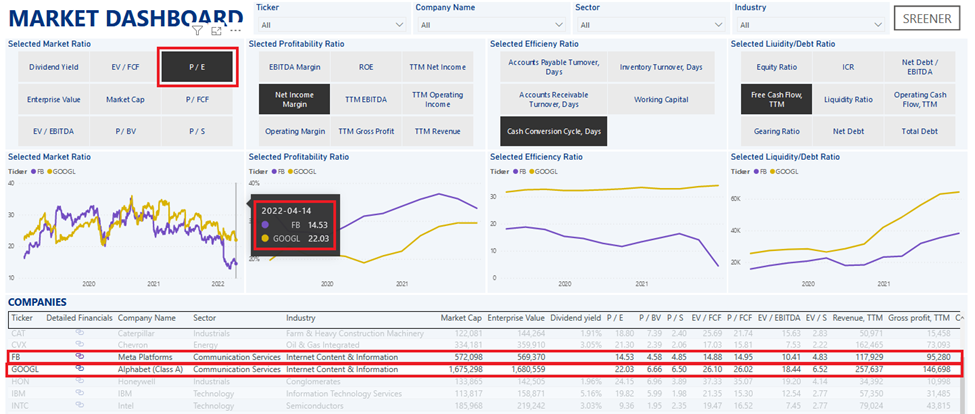
The price-to-earnings ratio of Meta Platforms as at 2022-04-14 is 14.53, while the Alphabet’s P/E ratio is higher and stands at 22.03 (we don’t compare it with TWTR because it has negative net income and negative P/E ratio is not applicable in the analysis)
At the end of 2021 Meta’s return-on-equity was 29.71%, which was a little bit lower than Alphabet’s 31.56% (even though up until mid-2021 FB had higher ROE than GOOGL).
At the end of 2021 Meta’s return-on-assets was 23.51%, which exceeded Alphabet’s ROA ratio which was 22.21%.
Balance Sheet
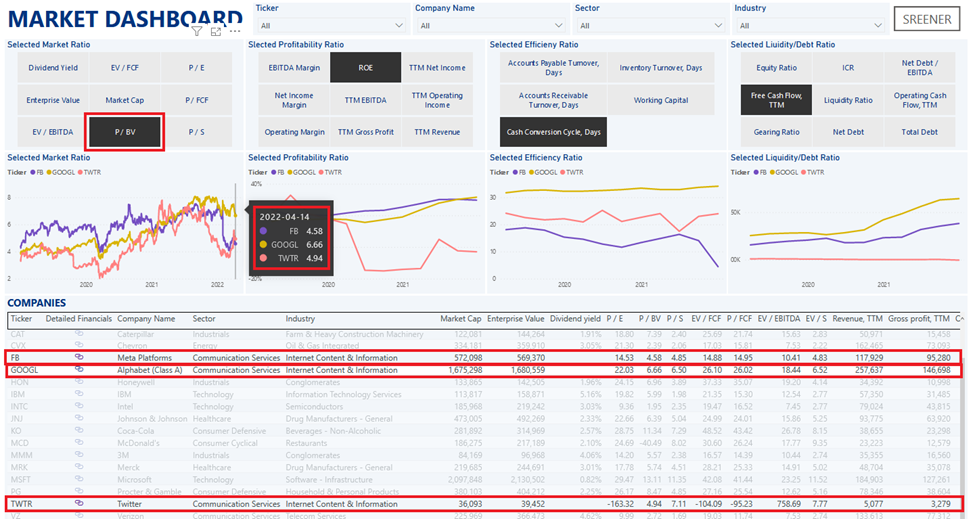
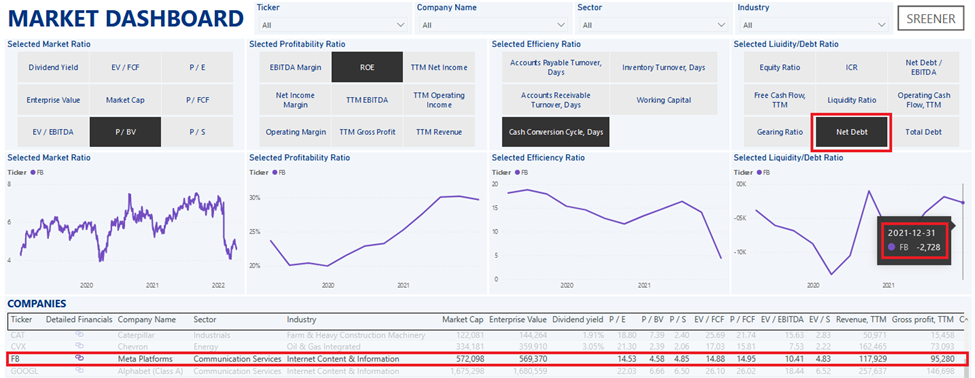
As of 2022-04-14 Meta Platforms’ price-to-book value was 4.58, while the main competitors had a higher price / book ratio: Alphabet’s was 6.66 and Twitter’s P/B ratio was 4.94.
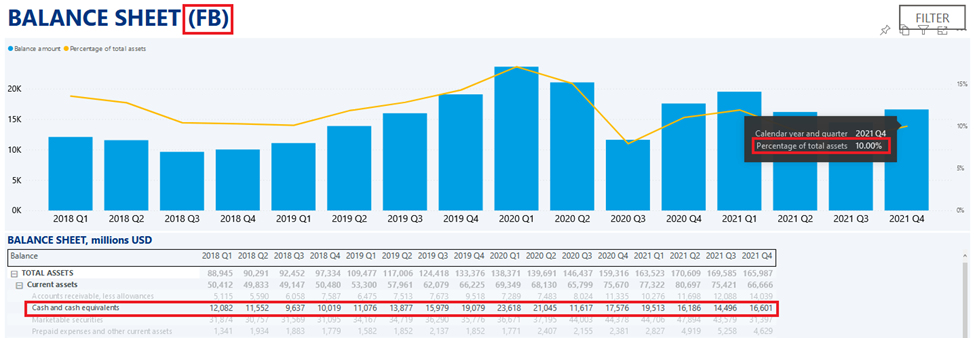
At the end of 2021 Meta Platforms’ cash and cash equivalents were $16.6 billion (which amounts to 10% of company’s total assets).
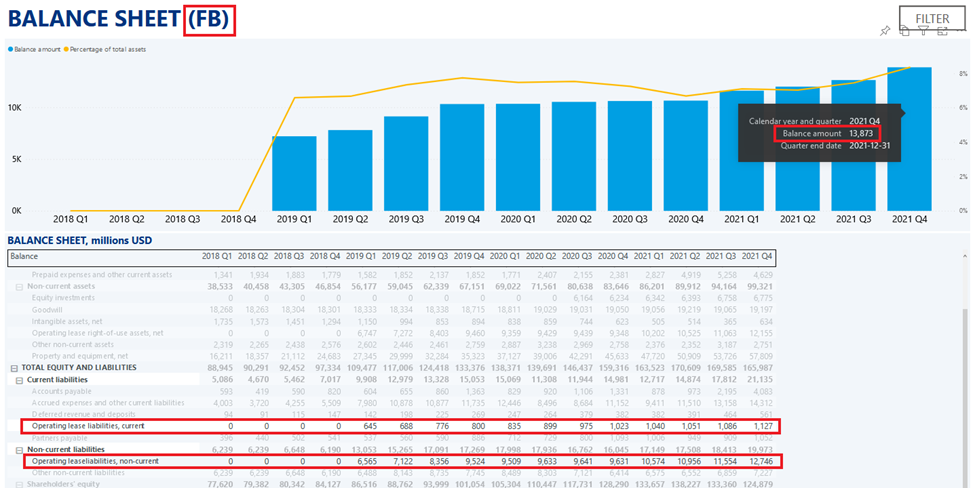
At the end of 2021 total debt of the company (consisting of current and non-current operating lease liabilities were $13.9 billion, which means that net debt of the company was $-2.7 billion (it means that if a company would pay all its leases, it would have $2.7 billion left in cash).
The equity ratio (which is equal to shareholder’s equity divided by total assets) at the end of 2021 for Meta was 75.23%. It is the highest out of the mentioned competitors (Alphabet has a ratio of 70.04% and Twitter has a ratio of 51.98%) – the higher the ratio, the lower the company’s liabilities are as a percentage of company’s assets.

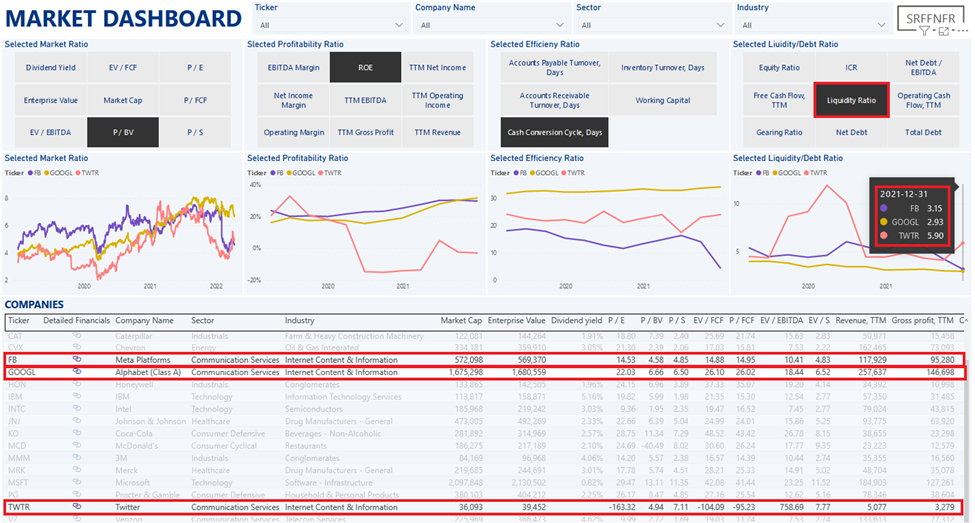
When looking at liquidity ratio Meta Platforms had a ratio of 3.15 at the end of 2021. The liquidity ratio shows how many times the current assets of the company is bigger than the current liabilities. Alphabet’s liquidity ratio was 2.93, while Twitters liquidity ratio was higher and was equal to 5.9.
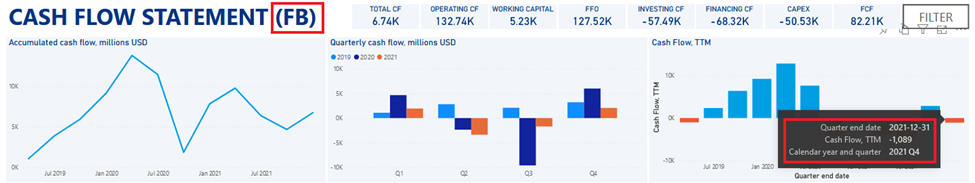
Cash Flow Statement
At the end of 2021 the trailing twelve-month total cash flow of FB was almost $-1.1 billion.
Price to free cash flow ratio as at 2022-04-14 for Meta Platforms was 14.95. Low P/FCF ratios typically mean the shares are undervalued. In comparison, the Alphabet’s P/FCF ratio was 26.02, while Twitter’s P/FCF ratio was negative (-95.27) due to negative free cash flow in the last year.
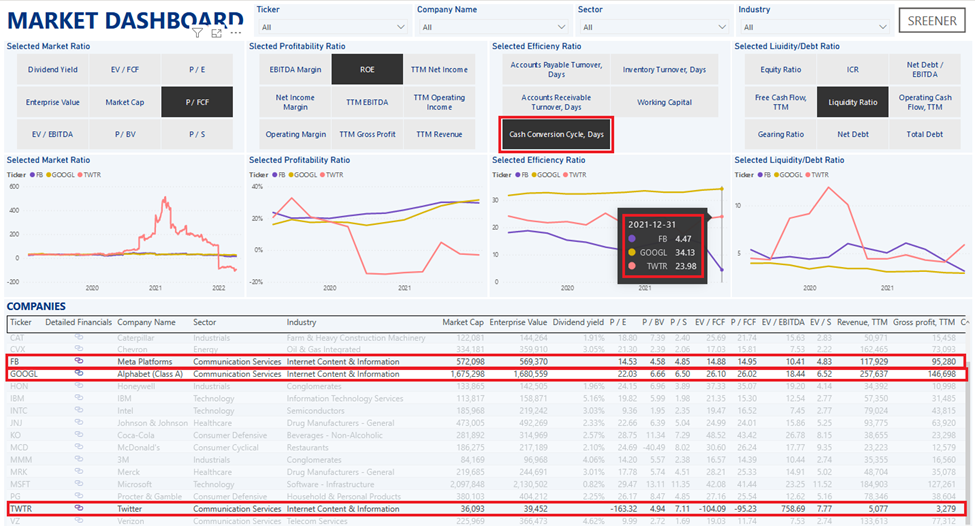
The cash conversion cycle (CCC) is a metric that expresses the time (measured in days) it takes for a company to convert its investments in inventory and other resources into cash flows from sales.
Both Alphabet’s and Twitter’s CCC are steady over time, while Meta Platforms’ CCC has decreased recently and is the lowest out of three of the companies.
Talking about dividends: none of these three companies are paying dividends at the moments.
Conclusion
+
- It is profitable company with high operating and net income margin
- Compared to competitors it is undervalued based on current price-to-sales, price-to-earnings and price-to-book ratios
–
- 4Q 2021 operating and net income was lower than during last year’s 4Q
- Return on equity and return on assets were decreasing in the last couple of quarters